.svg)

Piktochart is an AI-powered visual creation tool that enables users to generate professional infographics, banners, and posters quickly without design expertise. It offers comprehensive data visualization options, including pie charts, bar charts, and interactive maps, allowing clear communication of complex information. With an extensive library of icons, shapes, and design elements, users can customize visuals to fit specific needs, enhancing creativity and personalization. While Piktochart’s AI accelerates content creation and supports multiple formats, limited free features and a learning curve for advanced data visualization may challenge beginners.
Overview
Piktochart is an AI-powered visual creation tool that enables users to generate professional infographics, banners, and posters quickly without design expertise. It offers comprehensive data visualization options, including pie charts, bar charts, and interactive maps, allowing clear communication of complex information. With an extensive library of icons, shapes, and design elements, users can customize visuals to fit specific needs, enhancing creativity and personalization. While Piktochart’s AI accelerates content creation and supports multiple formats, limited free features and a learning curve for advanced data visualization may challenge beginners.
Core Features
🤖 AI-Powered Visual Creation
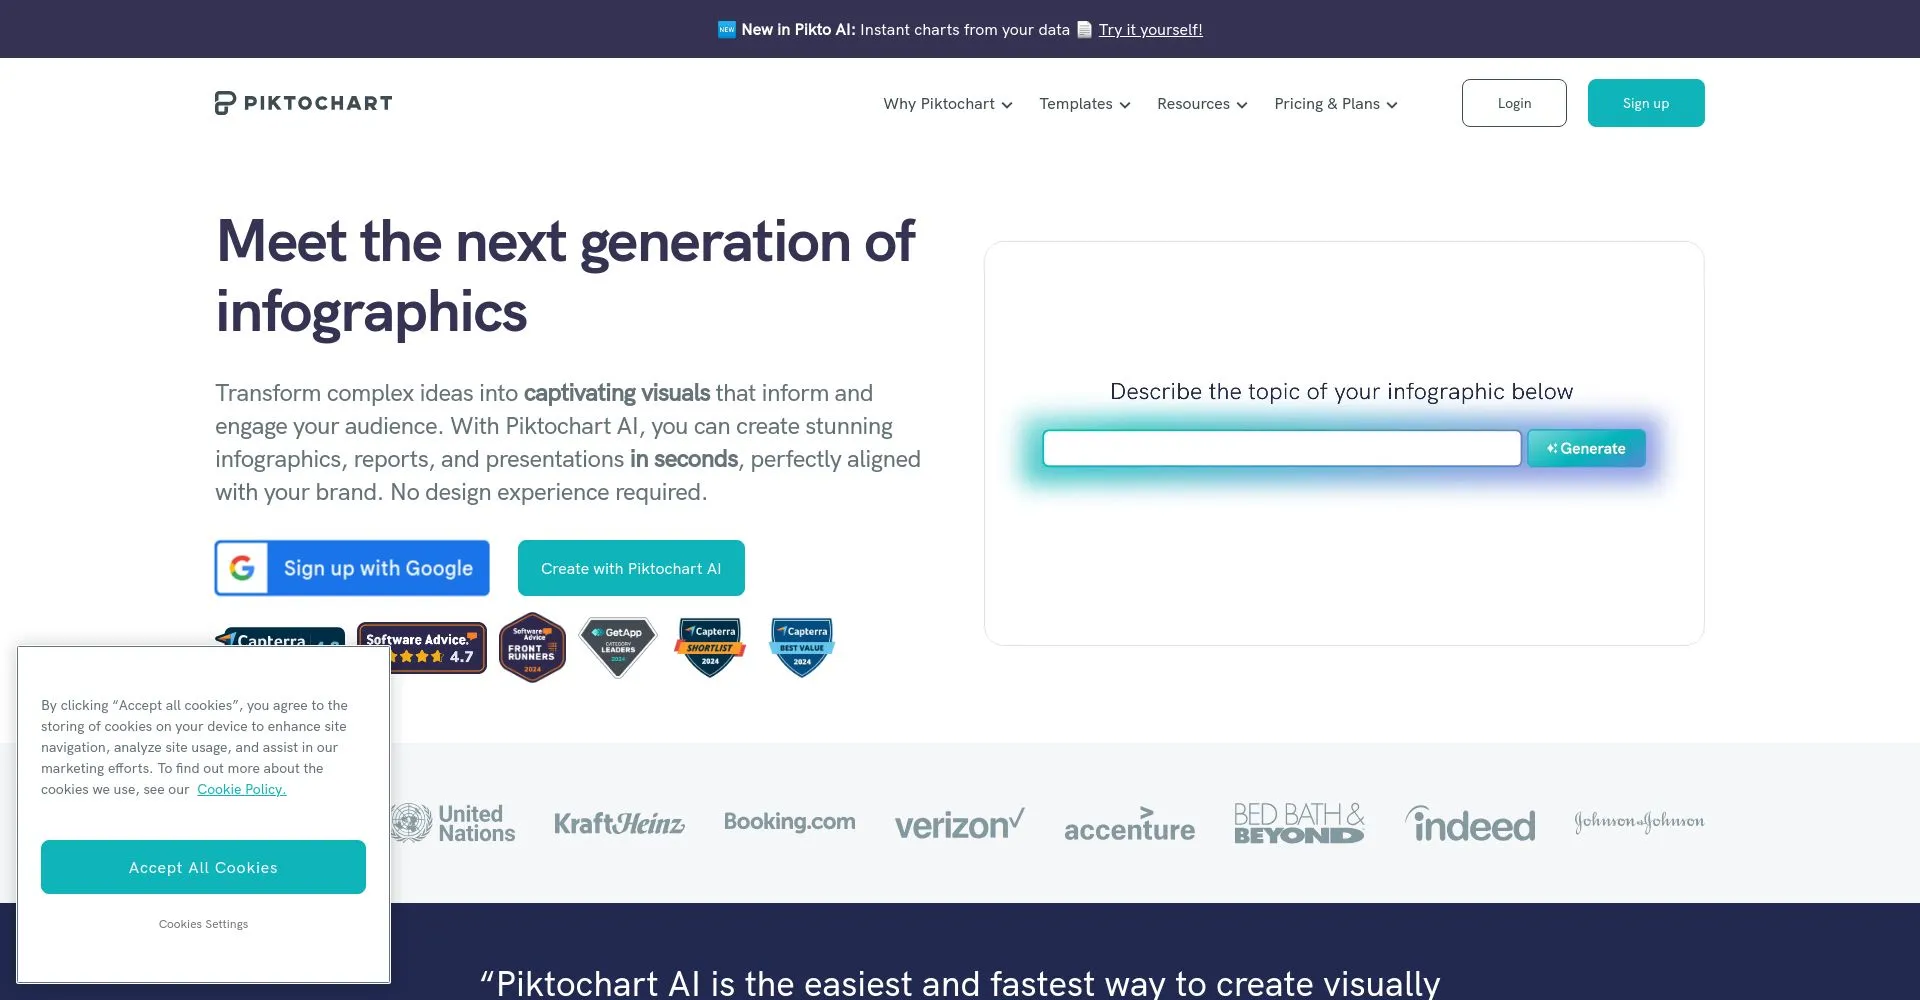
Piktochart AI transforms any idea or text prompt into professional infographics, banners, flyers, and posters within seconds. This feature eliminates the need for design skills, allowing users to generate high-quality, contextually relevant visuals effortlessly. It enhances user engagement by speeding up the creative process and offering unique, customized AI-generated images based on user input.
📊 Comprehensive Data Visualization Tools
Users can create various types of charts, including pie charts, bar charts, pictographs, and interactive maps in minutes. The platform supports seamless conversion of documents into engaging visuals without manual content copying. This flexibility enables clear communication of complex data, empowering users to effectively convey their messages with customized graphs, diagrams, and geographical visualizations.
🎨 Extensive Customization and Design Elements
Piktochart offers an expansive library of icons, shapes, illustrations, and photos, along with options to upload personal images. Advanced design components such as masked photos, lists, timelines, and comparisons allow users to tailor visuals precisely. This versatility enables users to create visually appealing, unique presentations and flowcharts that suit specific communication needs, enhancing personalization and creativity.
Pricing
Potential Users

Pros & Cons
Pros
Piktochart AI creates professional visuals quickly without design skills. It supports many formats—infographics, reports, charts. Extensive templates, easy customization, and AI-generated images save time and boost creativity.
Cons
Limited free features may frustrate users. AI outputs might need edits for accuracy. Complex data visualization could require learning, affecting beginners' satisfaction or speed. Customization could overwhelm new users.
Frequently Asked Questions
What is Piktochart?
Piktochart is an AI-powered tool for creating professional infographics, banners, and posters with customizable visuals and data visualization options, suitable for users without design expertise.
How does Piktochart work?
Piktochart uses AI to help users quickly create customizable infographics, banners, and posters with various data visualization options and design elements, even without prior design experience.
Can I use Piktochart for free?
Yes, Piktochart offers limited free features, but access to full functionalities and advanced features may require a paid plan. Check their website for detailed plans.
Does Piktochart offer templates?
Yes, Piktochart offers templates to help users create visual content quickly and easily.
Is Piktochart easy to learn for beginners?
Piktochart may have a learning curve for beginners, especially for advanced features, but its user-friendly interface and templates can help new users get started quickly.